


Vernier Graphical Analysis
Deskripsi Vernier Graphical Analysis
Version 3.0 supports Android devices running OS versions 4.3 and newer
Version 1.2 supports Android devices running OS versions 4.1 - 4.2.2
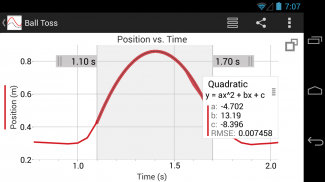
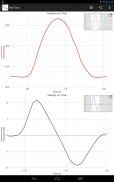
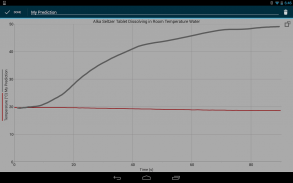
Use Graphical Analysis to seamlessly collect, analyze, and share sensor data in science and math classrooms. Graphical Analysis facilitates student understanding with real-time graphs of experimental data. Students are able to enhance their lab reports by easily determining statistics, performing curve fits, and adding annotations.
Graphical Analysis, in combination with supported hardware, makes it possible to use your mobile device to collect data from a wide range of Vernier sensors, including temperature, motion, force, pH, and more. You can also collect data from your mobile device’s built in accelerometers or manually enter data into the data table for analysis. Data can be wirelessly streamed to each member of a lab group using the Data Share features of LabQuest 2 or a computer running Logger Pro.
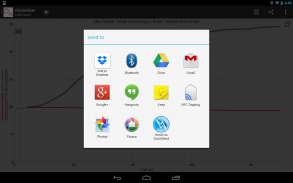
Once data have been collected or entered into Graphical Analysis, students can analyze the data, export data and graphs to create a lab report, or send their finished work to the teacher. Graphs can be exported to Photos, Mail, or note-taking apps, or printed on a printer. A CSV file of the data can be shared with other users or opened in different software, such as a spreadsheet program, for additional analysis.
Key Features - Data Collection
• Use LabQuest Stream to collect data from up to five sensors simultaneously.
• Collect and analyze data from a Go Wireless sensor or Go Wireless Link and a compatible Vernier sensor.
• Stream data to multiple students from a single source via wireless Data Sharing with LabQuest 2 or Logger Pro.
• Collect acceleration data using your mobile device's built-in accelerometers.
• Collect time-based or event-based data.
• Manually enter data and analyze them using Graphical Analysis.
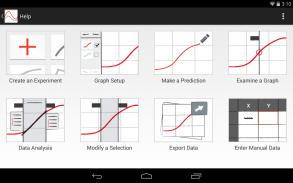
Key Features - Data Analysis
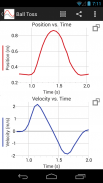
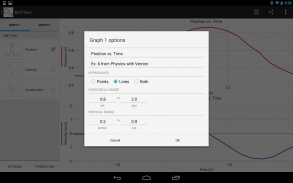
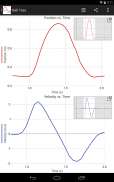
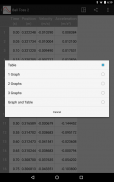
• Display one, two, or three graphs simultaneously.
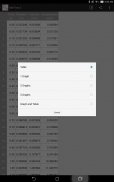
• View data in a table.
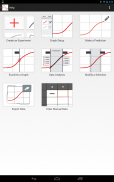
• Edit and auto-save data, graphs, annotations, statistics, and curve fits.
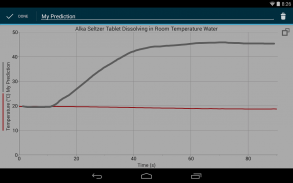
• Draw predictions on a graph.
• Pinch to scale graphs.
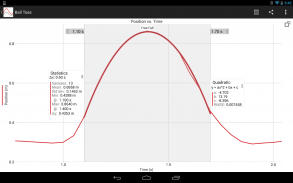
• Examine and select data.
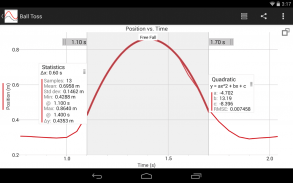
• Perform curve fits, including linear, quadratic, natural exponent, and more.
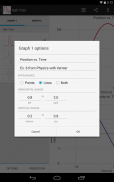
• Create text annotations and add graph titles.
• Export graphs and data.
Vernier Software & Technology has over 30 years of experience in providing effective learning resources for understanding experimental data in science and math classrooms. Graphical Analysis is a part of our extensive line of sensors, interfaces, and data-collection software for science education.</br></br></br></br></br></br></br></br></br></br></br></br></br></br></br></br></br></br></br></br></br></br></br></br></br></br></br></br>
Vernier Graphical Analysis - Versi 3.2
(04-12-2018)Vernier Graphical Analysis - Informasi APK
Versi APK: 3.2Paket: com.vernier.android.graphicalanalysisVersi Terakhir dari Vernier Graphical Analysis
Versi lain


Aplikasi pada kategori yang sama


Anda juga mungkin suka...
Aplikasi pada kategori yang sama


